|
Site Sponsored By: SQLDSC - SQL Server Desired State Configuration
|
|
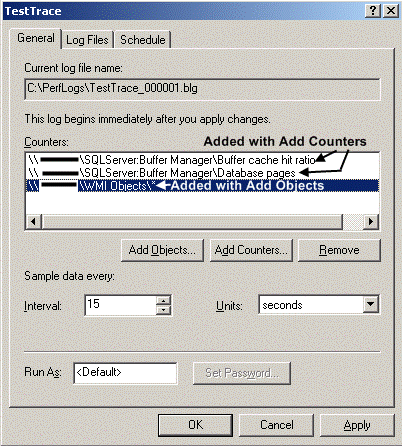
Integrating Profiler and PerfMon Log FilesBy Mladen Prajdić on 6 February 2008 | Tags: Performance Monitors , Profiler & Trace Troubleshooting SQL Server requires the use of both PerfMon (Performance/System Monitor) and SQL Trace files created by SQL Profiler or directly by SQL Server trace. Analysis of the gathered data is much easier if you can correlate your trace file with the PerfMon counters. In this article I'll show how to create a PerfMon counters log file and SQL Profiler Trace file, how to read them both and how to correlate the two files in SQL Profiler. Creating a PerfMon log fileOpen PerfMon (Control Panel -> Administrative tools -> Performance) and go to the Performance Logs and Alerts tree node. Right click the mouse and choose New Log Settings option. Type in the name you wish to give to your trace. You'll be presented with this window:
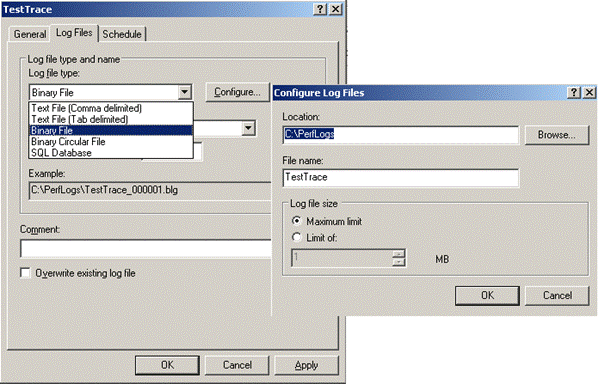
Picture 1: Add counters to a new PerfMon counters log file Choose the counters to monitor with the Add Counters button. With the Add Objects button you can add all the counters from a single object. On the Log Files tab you can choose the type of log (binary, CSV, etc...), set its destination, name, the maximum length of a single file, the filename format of the generated log files and a comment for the log. If the set log file length is exceeded a new counter log file is created.
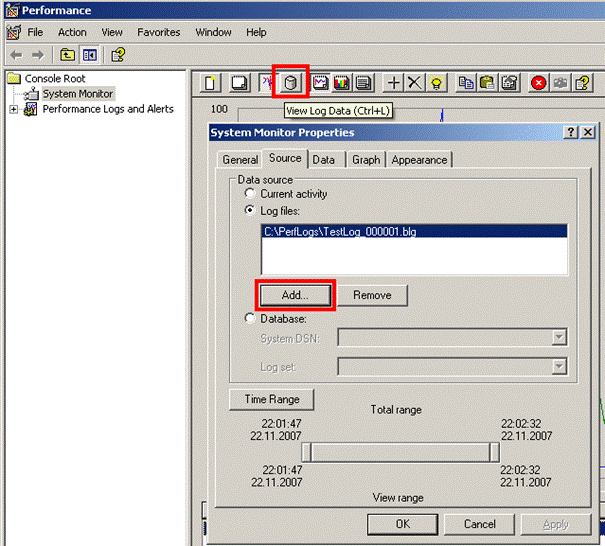
Picture 2: Set PerfMon counters log file format and location On the third tab you can set the scheduling options for the start and end of your log run. When clicking OK or Apply your log starts gathering data. The running status is shown with the green icon in the list next to log name in the list. Creating a SQL Profiler Trace fileStart SQL Profiler and go to File -> New Trace. Choose the server you wish to monitor. A window to set the Trace properties will open. Setting up trace properties is an art in itself. There are so many of them that you have to know which ones to chose for the specific problem you wish to troubleshoot. In the general tab, choose where to save the trace data, trace stop time and a template used to gather trace data. On the Events tab you can choose what events to monitor. Templates tabThere are a few predefined templates that cover some of the situations you're likely to troubleshoot like slow running queries or what stored procedures are being run. One of the most interesting templates is the TSQL_Replay. This template allows you to replay the saved trace data on another server. There are of course some requirements for this to work such as: Database Name or ID must be the same, all logins, users, their passwords and permissions must be the same. For full requirements reffer to Books Online under "TSQL_Replay template". You can replay a trace saved in a table as well as in a file. You can save your trace directly to a file or a table. When saving to a file you can enable file rollover which means that when a file reaches a predefined size a trace will create a new file to which it writes. This way you can have multiple small files that you can open individually rather than one big file. This also eases importing files into a table for analysys. Events and Columns tabThis tab holds the events and columns you can use to gather data relevant for your trace. If you wish to add new columns and filters to your existing ones check the "Show all events" and "Show all columns" checkboxes. A very useful option is the Column Filters window. On it you can put different filters on each column, like putting only your computer name in the HostName column and thus capturing only data coming from your computer. Or filtering only for a specific database, duration etc... After you've chosen the desired columns and events to monitor, start the trace. Reading a PerfMon log fileYou'd think that double clicking the .BLG or .CSV file in the Windows Explorer would be enough, wouldn't you? Well it's not. Double click only opens the PerfMon with the default counters and current activity. To read your log file you have to Click on the View Log Data (Ctrl+L) icon. Add your log file and choose the timespan you wish to observe like shown in the picture.
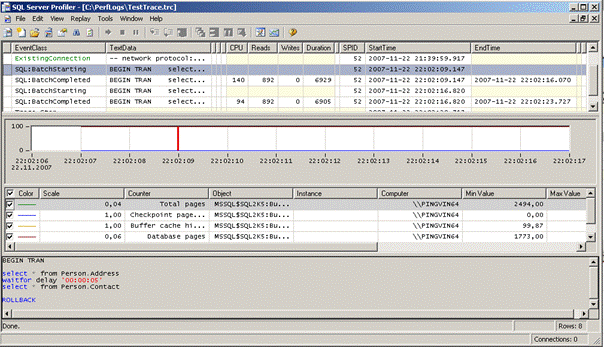
Picture 3: Open existing PerfMon counters log file Clicking OK will close the window and it'll look like nothing happened. Now you have to mouse right click and choose the counter you wish to inspect. And that's it. In my opinion PerfMon isn't the most intuitive application in the world but once you get used to it it becomes second nature. The only thing I haven't found yet is the way to capture already traced data to a log file without creating the log file first. For example: Open the PerfMon, wait for some counters' data, stop it, and then save that data to a log file. If anyone does know of a way to do that let me know. Reading a SQL Profiler Trace fileIn SQL Profiler you can open data from a file or a table with File -> Open menu option. If you have your data in multiple rolled over files SQL profiler will ask you if you'd like to open the next file after it reaches the end of the current file. You can also replay your trace using the Replay menu in which you can even set breakpoints. Personally I like to analyze my trace files with SQL. To do that you have to have the data in a trace table. If you have a file you should import that file into the table. The only way to do that is by using the select * from fn_trace_gettable('c:\MyTraceFile.trc', default) The first parameter is obviously the path to the trace file on the server's disk. The second parameter is the number of rolled over files to be read. The default value is -1 which means all files are read. If you want to read just one of many rolled over files use 1 as your parameter value. Although you could use the function to read the trace file each time, the better way is to simply import the trace into a table and query the table itself since reading the file each time is slow. A simple way to do this is: select IDENTITY(BIGINT, 1, 1) AS RowNumber, * into MyTraceTable from fn_trace_gettable('c:\MyTraceFile.trc', default) where 1 = 0 -- just create the table without any data After you have the table definition you can index it to your liking and then simply use insert to populate the table: insert into MyTraceTable(<columnsToInsertInto>) select <columnsToInsert> from fn_trace_gettable('c:\MyTraceFile.trc', default) Combining SQL Profiler Trace file and PerfMon log fileStart SQL Profiler and open a trace file in it. The SQL Trace file and the PerfMon log file must be time synchronized. So either you have to be gathered on the same machine or the 2 machines have to be time synchronized. Wait until the SQL Trace file is fully loaded. Then go to File -> Import Performance Data... Choose the PerfMon log file (.BLG, .CSV) that correlates with the SQL trace file. A dialog will open asking you to select the counters you'd like to display. Click OK and you should get a screen looking similar to this:
Picture 4: Combine SQL Profiler Trace file and PerfMon counters log file By clicking on the PerfMon graph you can see that the selected row in your trace changes. The PerfMon counter has the minimum polling interval of 1 second so you will get more than one sql event per PerfMon counter and the selected row in the trace is the row that best corresponds with the PerfMon counter at that time. ConclusionCombining PerfMon and SQL Trace data can help you pinpoint events that happened when a counter you're measuring behaves in a way that it shouldn't. By precisely finding SQL statements running at that time you can seriously narrow the area of search for troubleshooting.
|
- Advertisement - |